Key points in this article:
- As of February 2025, Instagram had 3 billion monthly active users.
- India had the largest Instagram audience size as of October 2025, with over 480 million users.
- Instagram earned almost $67 billion in revenue in 2024, an increase of 34.3% compared to the previous year.
- Users aged 25 to 34 years old made up the biggest share of the network’s advertising audience (33.0%) as of January 2025.
- Carousel posts tend to earn Business accounts the highest engagement on Instagram.
Instagram, now part of Meta, has become the benchmark for social media platforms in terms of image and brand communication.
This social network, co-founded in 2010 by Kevin Systrom and Mike Krieger, has been owned by the giant Facebook since 2012.
After more than 10 years of existence, Instagram is at the center of international marketing strategies. As mobile has become a huge part of users’ daily lives, brands’ marketing strategies are permanently tied to Instagram.
Every year, the platform releases new features, advancing practices, regulations, and standards. The social network has disrupted the way brands and their content are approached.
What are the top Instagram stats for marketers to know if they want to expand their reach on the platform and beyond? What are the new Instagram trends? What is the Instagram audience?
Discover all the essential data to understand and know everything about the Instagram app in this blog post!
Instagram’s key global stats
How many monthly active users does Instagram have?
Statista reports that, as of February 2025, Instagram counted 3 billion monthly active users, just behind Facebook, which had 3.07 billion monthly active users.
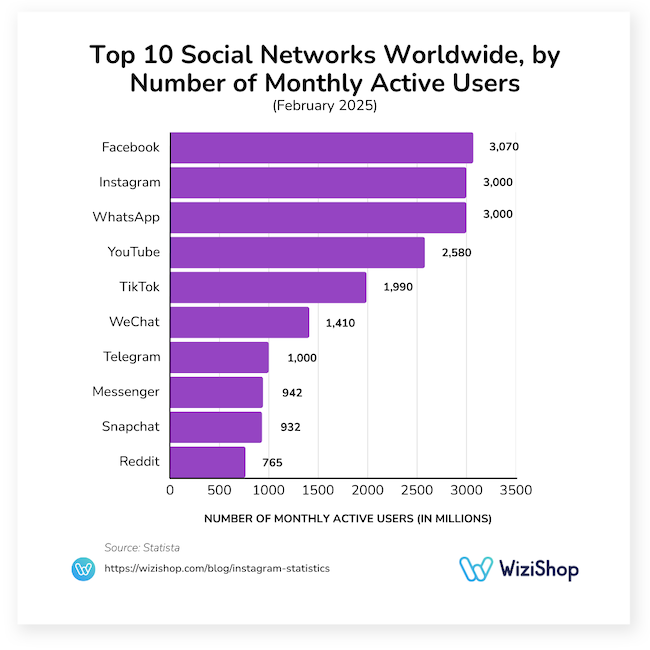
In the table below, you’ll find the top 10 social networks worldwide, in addition to the number of monthly active users for each platform.
| Social media platform | Number of monthly active users |
|---|---|
| 3.07 billion | |
| 3.00 billion | |
| 3.00 billion | |
| YouTube | 2.58 billion |
| TikTok | 1.99 billion |
| 1.41 billion | |
| Telegram | 1.00 billion |
| Messenger | 942 million |
| Snapchat | 932 million |
| 765 million |
Source: Statista
Furthermore, data from a Kepios study shared by DataReportal shows that an estimated 1.74 billion users were likely to be reached by advertising on the platform as of January 2025. This represents an increase of about 5.5% compared to the network’s potential advertising reach audience in January 2024.
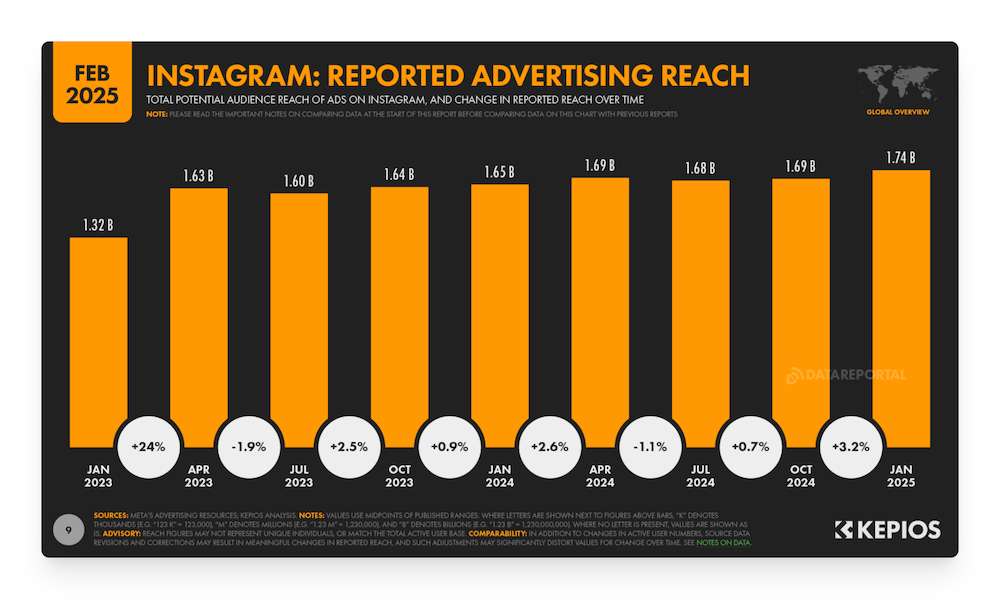
Source: DataReportal
Which country has the highest number of Instagram users?
According to Statista, India takes the top spot when it comes to the number of Instagram users, with 480.55 million people using the platform as of October 2025.
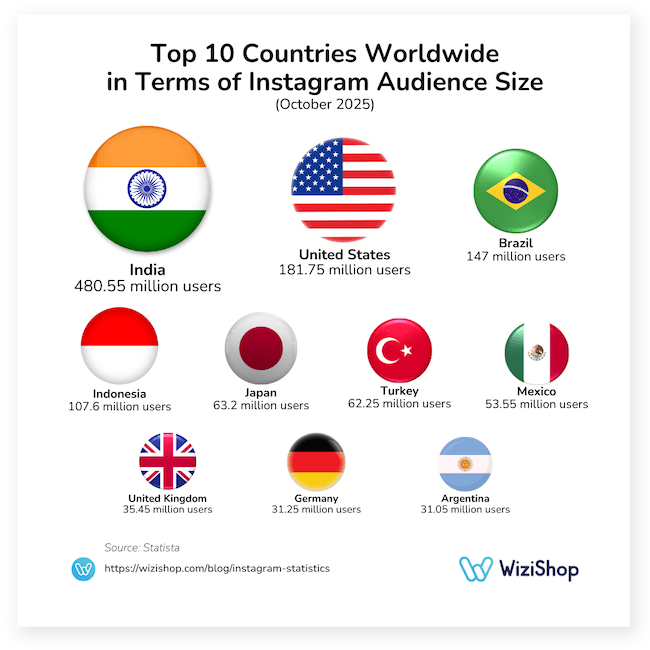
The following table details the rest of the top 10 countries with the largest Instagram audiences as of October 2025, along with the number of people using the platform for each country.
| Country | Number of Instagram users |
|---|---|
| India | 480.55 million |
| United States | 181.75 million |
| Brazil | 147 million |
| Indonesia | 107.6 million |
| Japan | 63.2 million |
| Turkey | 62.25 million |
| Mexico | 53.55 million |
| United Kingdom | 35.45 million |
| Germany | 31.25 million |
| Argentina | 31.05 million |
Source: Statista
How much does Instagram earn in revenue?
Business of Apps data reveals that Instagram generated approximately $20.5 billion in revenue in Q2 2025, up about 31.4% from the same quarter in the previous year.
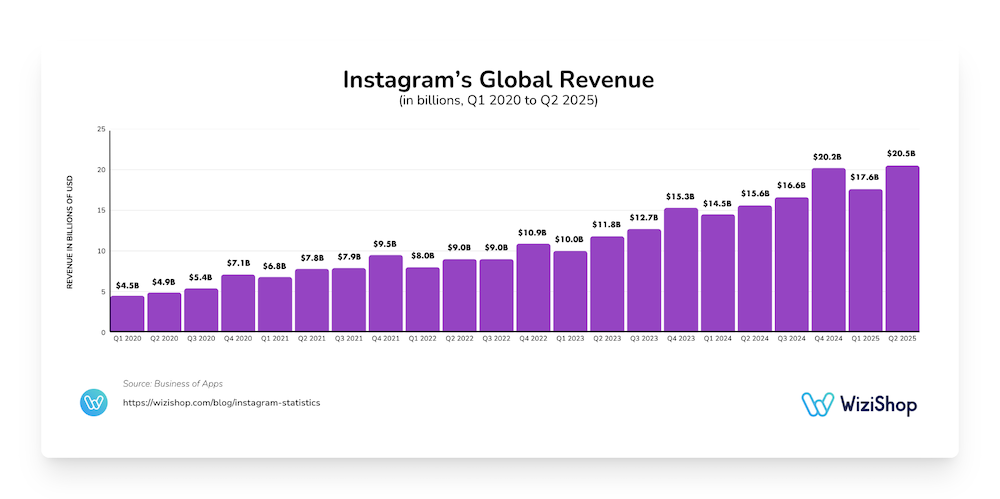
For a summary of the annual revenue generated by Instagram over the past few years, check out the table below.
| Year | Annual revenue generated by Instagram |
|---|---|
| 2018 | $10.3 billion |
| 2019 | $16.2 billion |
| 2020 | $21.8 billion |
| 2021 | $32 billion |
| 2022 | $36.9 billion |
| 2023 | $49.8 billion |
| 2024 | $66.9 billion |
Source: Business of Apps
What accounts have the highest number of followers on Instagram around the world?
On many social networks, international stars have exceptional communities, popular personalities mainly from the world of show business and the world of soccer.
And Instagram is no exception!
Based on data from Social Blade, the profile with the largest following on Instagram was Instagram itself with 697 million followers in December 2025.
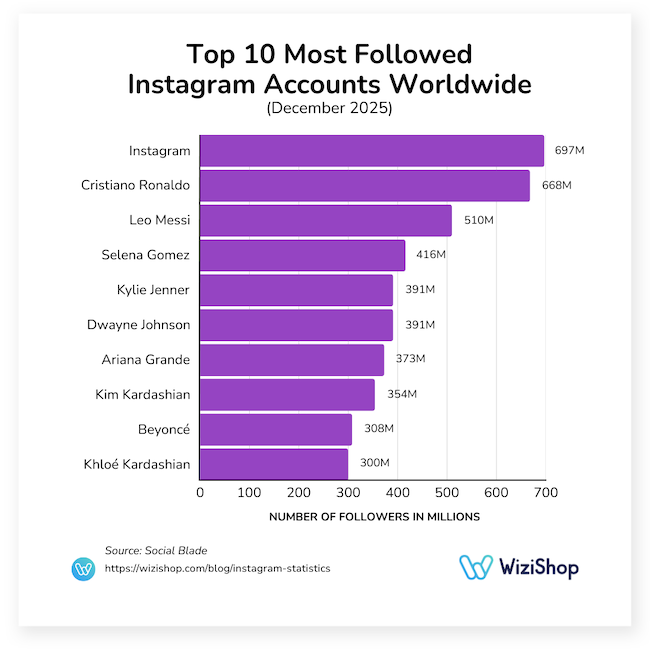
Take a look at the table below for more information on the rest of the top 10 Instagram accounts with the highest number of followers as of December 2025.
| Account | Number of Instagram followers |
|---|---|
| 697 million | |
| Cristiano Ronaldo | 668 million |
| Leo Messi | 510 million |
| Selena Gomez | 416 million |
| Kylie Jenner | 391 million |
| Dwayne Johnson | 391 million |
| Ariana Grande | 373 million |
| Kim Kardashian | 354 million |
| Beyoncé | 308 million |
| Khloé Kardashian | 300 million |
Source: Social Blade
Instagram audience demographics
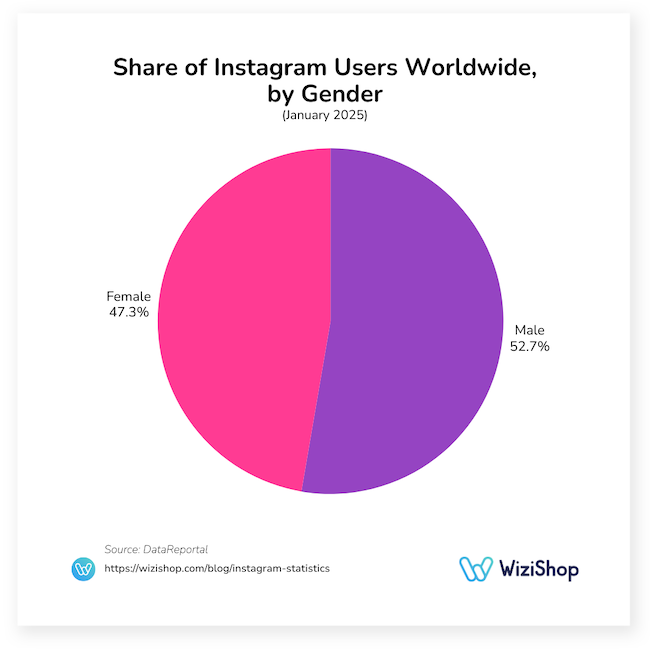
What is the gender breakdown of Instagram’s audience?
Instagram users were split pretty evenly when it comes to gender, though male users made up a slight majority of the platform’s audience at 52.7% compared to female users at 47.3%, using Meta January 2025 data shared by DataReportal.
What is the age breakdown of Instagram’s audience?
DataReportal also states that, according to Meta’s data, the age group making up the largest share of Instagram’s global advertising audience (aged 18+) was users aged 25 to 34 years old at 33%, as of January 2025.
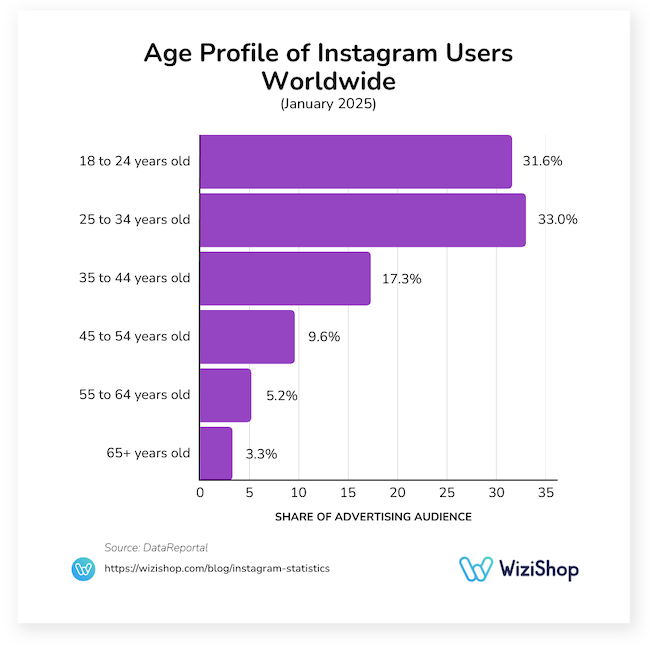
The following table displays Meta’s reported stats about the share of the global advertising audience (users aged 18 and older) on Instagram for different age groups.
| Age group | Share of global advertising audience (18+) |
|---|---|
| 18–24 years old | 31.6% |
| 25–34 years old | 33.0% |
| 35–44 years old | 17.3% |
| 45–54 years old | 9.6% |
| 55–64 years old | 5.2% |
| 65+ years old | 3.3% |
Source: DataReportal
How popular is Instagram with Generation Z compared to other digital platforms?
According to a 2024 eMarketer study examining various digital platforms and their penetration rates among Generation Z users in the United States, Instagram came in second place, being used by 72.5% of the U.S. Gen Z population.
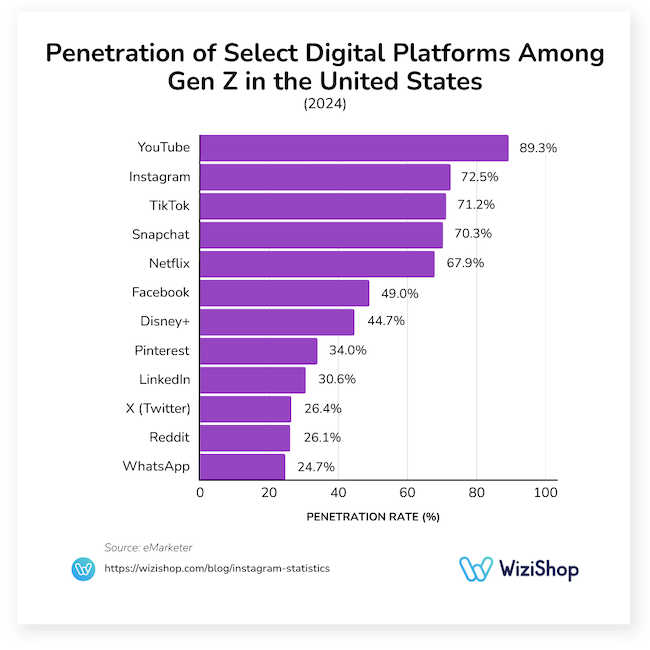
The social network came in behind YouTube, used by 89.3% of Gen Z in the US, and just ahead of TikTok, used by 71.2% of Gen Z in the US.
The penetration rate of the selected digital platforms among Generation Z in the US can be seen in the table below as well.
| Digital platform | Penetration rate among Gen Z in the United States |
|---|---|
| YouTube | 89.3% |
| 72.5% | |
| TikTok | 71.2% |
| Snapchat | 70.3% |
| Netflix | 67.9% |
| 49.0% | |
| Disney+ | 44.7% |
| 34.0% | |
| 30.6% | |
| X (Twitter) | 26.4% |
| 26.1% | |
| 24.7% |
Source: eMarketer
Instagram engagement statistics
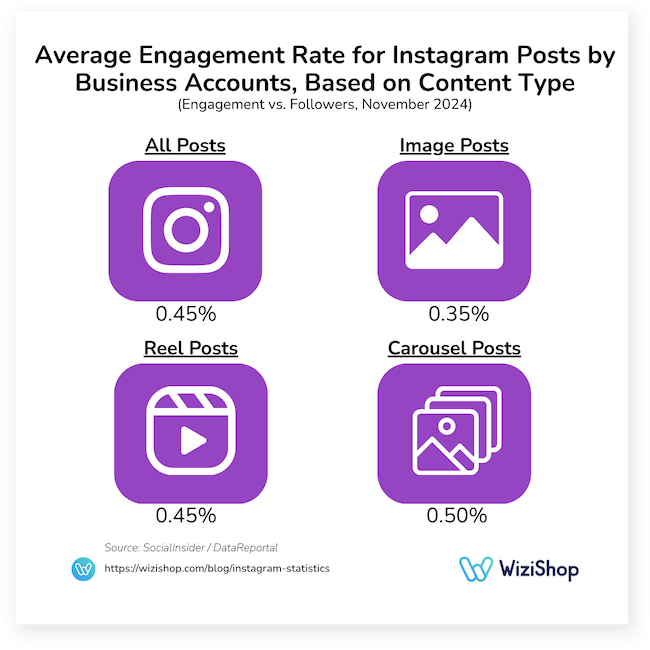
What is the average engagement rate for Business profiles on Instagram?
Using data reported by SocialInsider, DataReportal shared that the overall average user engagement rate (examining engagement vs. followers) for Business accounts on Instagram was 0.45% as of November 2024.
It’s worth noting that the average engagement rate for Instagram profiles with a Business account varies depending on how many followers the profile has, with an increase in follower count associated with a decrease in average engagement rate, as shown in the table below.
| Business profile’s number of followers | Average Instagram engagement rate |
|---|---|
| Fewer than 10,000 | 0.60% |
| 10,000 to 100,000 | 0.40% |
| More than 100,000 | 0.35% |
Source: DataReportal
What type of content has the highest engagement rate for Instagram Business accounts?
Images, Reels, carousels…Instagram posts can take various forms, but what type of content provides Business accounts with the most engagement on the platform when looking at engagement vs. follower count?
According to SocialInsider data shared by DataReportal, carousel posts were the winner as of November 2024, with an average engagement rate of 0.50% compared to the overall average of 0.45%.
This type of content was followed by Reel posts, with an average engagement rate of 0.45%, and image posts, with an average engagement rate of 0.35%.
What is the best time to post on Instagram for the highest engagement?
Whether you’re targeting Miami, New York, Canada, Europe, France, or just Paris, the ideal time to share your Insta posts can vary if you want people to engage with your content.
As determined by Buffer, though, posting on weekdays at 3 p.m. and 6 p.m. (in the time zone of the audience you plan to target) will generally be best in terms of user engagement on Instagram.
Check out Buffer’s heat map below to see how user engagement changes depending on the time and day.
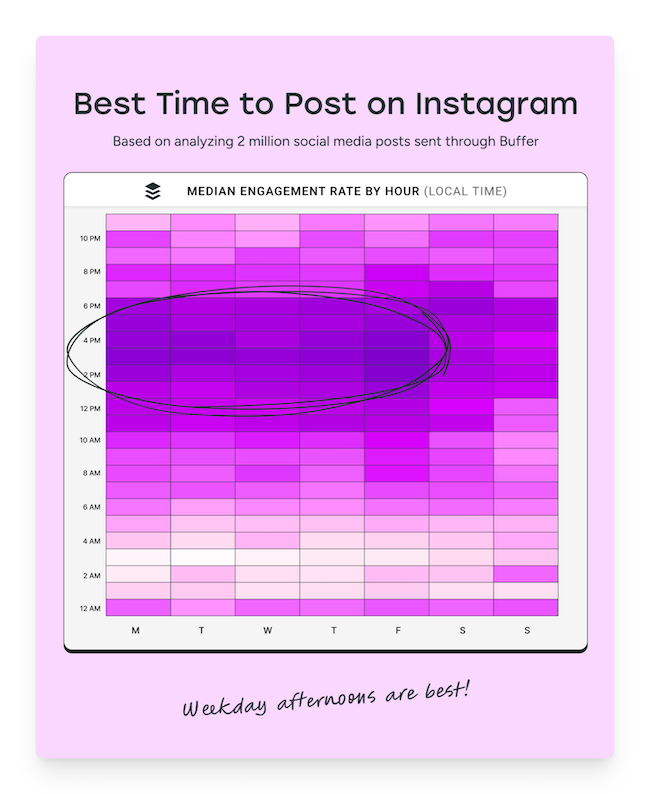
Source: Buffer
Instagram Stories statistics
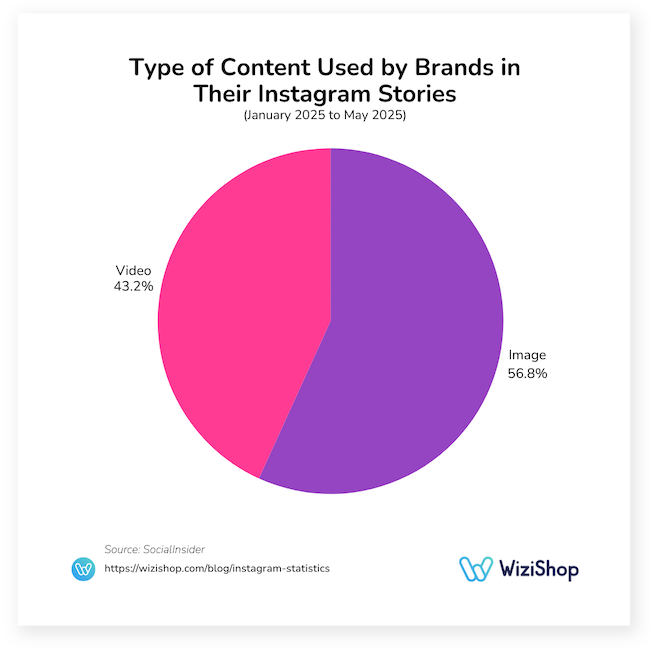
What kind of content do brands prioritize in their Instagram Stories?
Based on SocialInsider data from January 2025 to May 2025, image content had an edge over video content in terms of what brands are sharing in their Instagram Stories, with images being included 56.8% of the time, compared to videos at 43.2%.
At what point is exit rate highest for Instagram Stories?
When sharing Stories on Instagram, it seems that making a good initial impression is key to getting people to stick around and watch your content.
Exit rate (percentage of people who stop watching your Stories) tends to be highest at the start, with SocialInsider reporting that 23.8% of users stopped watching after the first Story in 2025.
This rate decreases to 20.5% on the second Story and 18.5% on the third.
What’s more, exit rates have increased since 2024, indicating that Instagram users’ attention spans are becoming smaller when it comes to Story content.
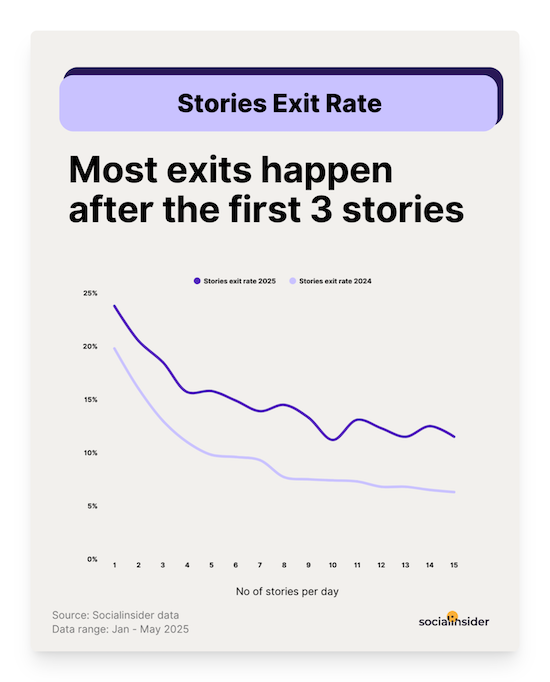
Source: SocialInsider
How often do brands post Instagram Stories?
If you have an ecommerce brand, Stories will play an important role in your Instagram marketing strategy, helping retain and stay in touch with your audience.
As your business grows, you’ll likely find that your strategy will involve upping your Stories game in terms of frequency, as SocialInsider determined that larger brands tend to be more active concerning their usage of Stories on Instagram.

Source: SocialInsider
More details on the average number of Instagram Stories shared per month based on follower count are displayed in the following table.
| Number of followers | Average number of Instagram Stories per month |
|---|---|
| 1,000 to 5,000 followers | 12 Stories per month |
| 5,000 to 10,000 followers | 17 Stories per month |
| 10,000 to 50,000 followers | 35 Stories per month |
| 50,000 to 100,000 followers | 50 Stories per month |
| 100,000 to 1,000,000 followers | 80 Stories per month |
Source: SocialInsider
Importance of Instagram for businesses
Instagram remains one of the most influential platforms for businesses looking to build brand awareness, engage with customers, and drive meaningful results.
Its ever-growing user base and highly visual format make it a powerful space for storytelling and community building.
Understanding Instagram statistics is essential because data reveals what truly resonates with audiences, from content performance to user behavior and trends.
With the right insights, businesses can refine their strategies, make informed decisions, and ultimately maximize their impact.
To help take your social media marketing strategy to the next level, be sure to check out the following articles: