
Among the popular SEO levers, log analysis has become an increasingly recurrent topic.
Often seen as complex for people without much technical knowledge, access to logs is also impossible on all SaaS ecommerce solutions on the market.
In order to strengthen our desire to offer an ecommerce solution that’s always more optimized for SEO, we strive to get in touch with major players in the industry. That’s why we recently officially announced our partnership with the French tool Seolyzer!
The WiziShop solution is the first SaaS platform in the world to make it possible to analyze logs on your online store to effectively improve your SEO.
In order to present the software and the different features it offers, here’s a complete guide. This article will also be updated regularly as new features become available on the tool!
Seolyzer presentation
Link to the tool: Seolyzer
This French tool, developed in 2017, aims to make log analysis accessible to everyone.
The logs are present in a file that contains all the calls (hits) to the server. When resources are loaded on a page (css, font, image, javascript,...), a log line is generated for each element, directly in the log file.
The file is composed of many lines representing all the hits generated on your site.
Within these hits are internet users’ visits but also those of search engine robots! This is where it gets interesting.
The Google search engine bots have distinct IP addresses. For each hit, the IP of the visit is indicated in the file. Do you see what I'm getting at?
This online tool processes the logs and reconstructs the path of Googlebot on your site!
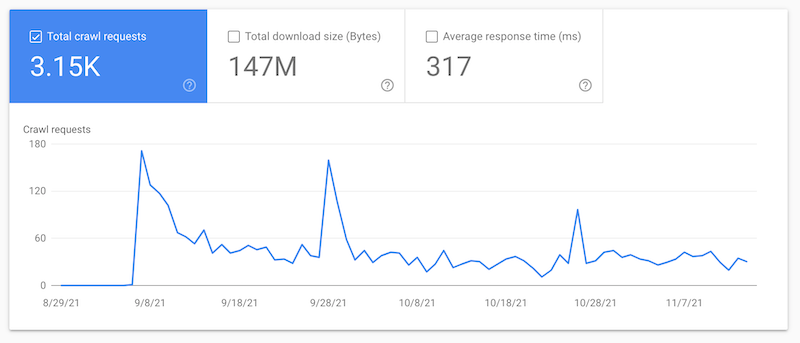
This data is also displayed in the Search Console in the https://search.google.com/search-console/settings/crawl-stats tab.
Unlike a tool like Seolyzer, the data isn't live (a few days late), and it doesn't contain all the information necessary for good optimization.
Here are, in detail, the features offered by the software and the various SEO improvements that you can get out of it.
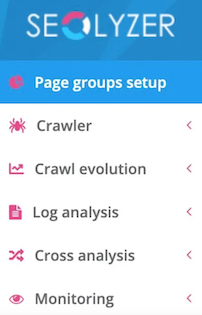
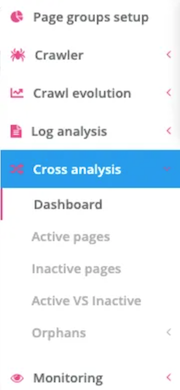
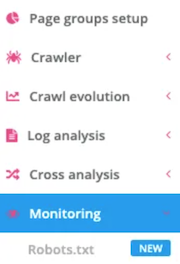
Page groups setup
This element is important to configure because it allows you to categorize the pages of your site to obtain a more relevant vision within the tool.
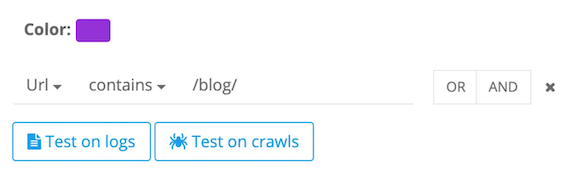
You can, for example, create groups for your products, your categories, your blog, your mandatory content (Terms and Conditions, Legal Notice...), etc. This classification will then allow you to detect the passage of the robot on each section of your store.
The tool also offers the creation of subcategories to further refine the classification.
Example of blog classification:
Example of general terms and conditions and legal terms:

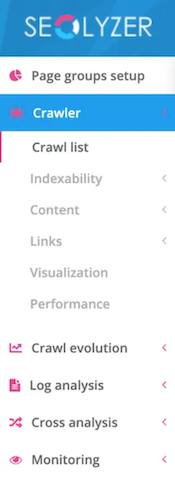
Crawler
Like any good SEO tool, the crawl function is a must!
The crawl process represents the exploration of the different pages and elements of your website by search engine robots or tools.
This section allows you to launch a crawl of your site, from a starting URL.
This feature is very useful for exploring all the URLs in your online store and highlighting key information and points to correct.
The additional advantage of this tool is that you can then cross-reference your results with your logs. This cross-referencing allows, among other things, to identify your orphan or inactive pages. I'll tell you more about this later in the article!
In this section, you’ll find different tools:
Crawl List
This is where you can start your crawl and define the configuration (crawl speed, schedule, domain and subdomain, user-agent, etc).
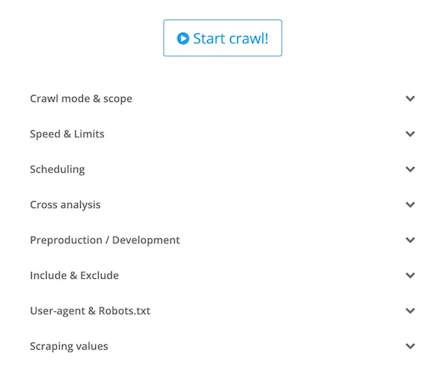
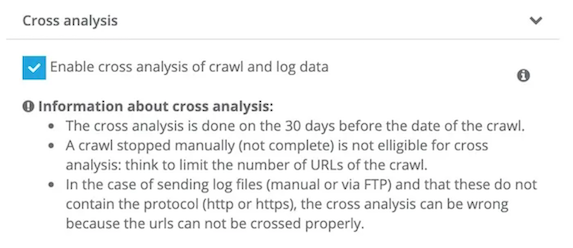
The important feature that I advise you to activate once the tool has retrieved data from the logs is “Cross Analysis.”
Indexability
In the “Indexability” section, you’ll be able to see all the URLs browsed and discover a variety of relevant analyses.
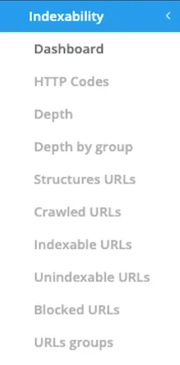
- Dashboard
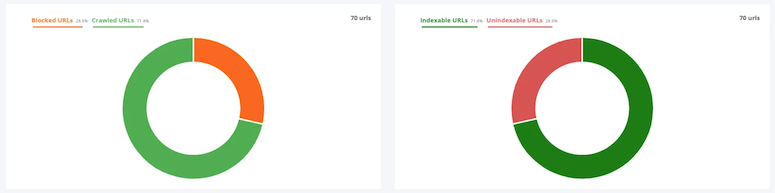
On the left graph, you can see the percentage of URLs that are blocked for search engines on your site (Blocked URLs). They appear in this section because they are, most of the time, blocked via the robots.txt file of your site.
You also have the percentage of URLs allowed to be crawled (Crawled URLs).
On the right graph, these are the URLs that cannot be indexed by search engines (Unindexable URLs). They include those blocked via robots.txt but also those that contain, for example, a noindex tag, HTTP error codes, a canonical URL that points to another page, etc.
And finally, the Indexable URLs.
- HTTP Codes
This tab highlights all HTTP codes encountered (301, 404, 200, 500,..).
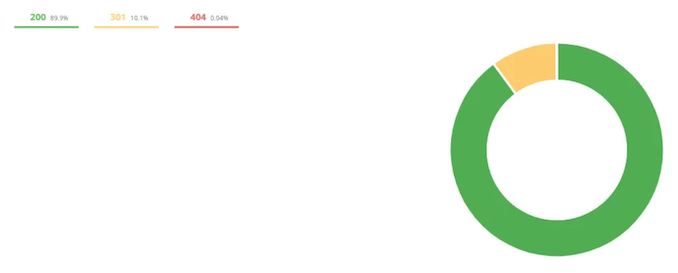
Studying HTTP codes allows you to easily detect faulty links within your store in order to correct them.
In the example above, the majority (89.9%) are in code 200, which is a good result. On the other hand, for codes 301 and 404, you will have to check the URLs to make corrections.
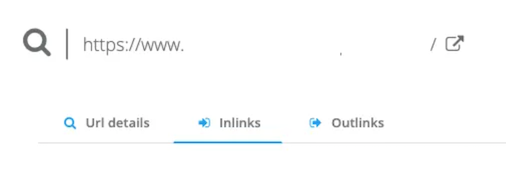
When you detect a 301 for example, you just have to click on the URL:

A detail panel of the URL is displayed, and you then just have to go to “Inlinks” to discover the links pointing to this page to correct them.
- Depth
The depth of a URL represents the number of clicks from the home page to access it.
On an ecommerce site, between categories, subcategories, and pagination, content can quickly become very deep. This frequently leads to problems related to a loss of power.
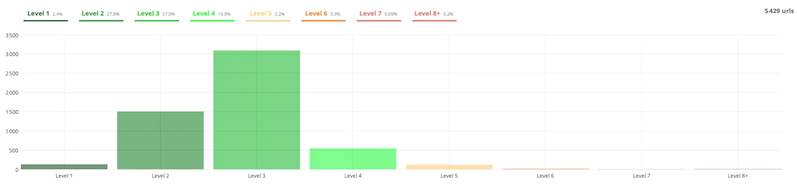
In this example, there are eight levels of depth. This means that some pieces of content are accessible at eight clicks from the homepage!
So you should think about moving them closer together to get to about three or four clicks.
- Depth by group
This tab is similar to the previous one but it takes your “Page groups setup.”
It allows you to detect which parts of the site are too deep. Are they blog posts, product pages, subcategories,...?
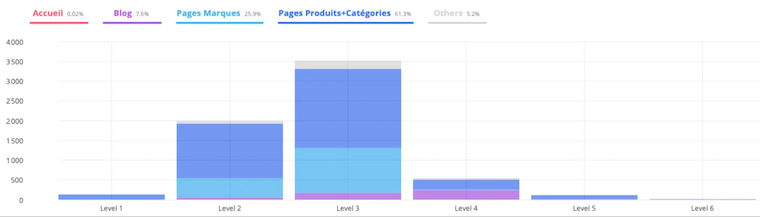
These analyses are very useful to detect low-powered pages and, if necessary, implement corrections, such as internal linking that’s closer to the home page.
- URL structures
The “URL structures” tab lists all the URLs detected on the site during the crawl.
- Crawled URLs, Indexable URLs, Unindexable URLs, Blocked URLs
These tabs show, in detail, the graphs that we’ve seen in the “Dashboard” part and list the different URLs concerned.
- URLs group
Finally, the “URLs group" tab shows the different groups that you’ve created in “Page groups setup.”
This tab allows you to detect, at a glance, the volume of each category in percentage based on your filters.
Content
The “Content” tab allows you to study the elements related to content during the crawl.
- Number of words
Here, you can easily detect the percentage based on the number of words in your site.
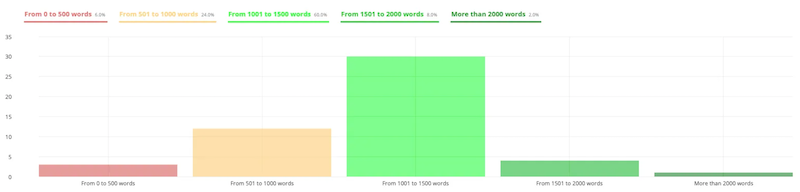
For example, here, we notice that the majority has between 1,000 and 1,500 words, which is a very good indicator.
If your site has a majority of pages between 0 and 500 words, it may be beneficial to work on your texts because you aren’t fully exploiting your SEO potential.
However, note that there’s no exact rule about the number of words needed in your content to rank. It’s on a case-by-case basis that you must analyze your texts and your positions and check if the optimization of your content is a good idea.
- Missing titles
The title is one of the most important tags in SEO.
If the tool detects a missing title, it’s quite possible that you need to add it to better position your content in search engines.
- Missing descriptions
The meta description doesn’t have a direct impact on the ranking but it’s a shame not to fill it in because it helps to encourage users to click on your site in the results pages and improve your click-through rate (CTR).
If some descriptions aren’t present, think about adding them!
- Missing H1
As for the title tag, the H1 is important. This title must be present to ensure a good positioning of your page.
Be careful, because the tool may return missing H1 tags for the pagination of your product categories or your blog. This absence of tag is voluntary with our solution to de-optimize them.
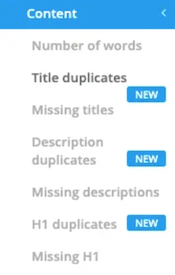
- Title, description, and H1 duplicates
This recent addition to the tool allows you to identify duplicate tags within your site.
The result, in the form of a graph, shows you the number of duplicated tags, the number of missing tags and the number of unique tags.
Links
The “Links” tab allows you to highlight the most powerful pages of your site based on your internal linking.
Depending on the number of times the links are present on your store, the tool will give you a simplified estimate of the internal PageRank.
If you notice that most of your pages with the highest PageRank aren’t very beneficial for SEO (general terms and conditions, contact, shopping cart, etc.), you may have some optimizations to do!
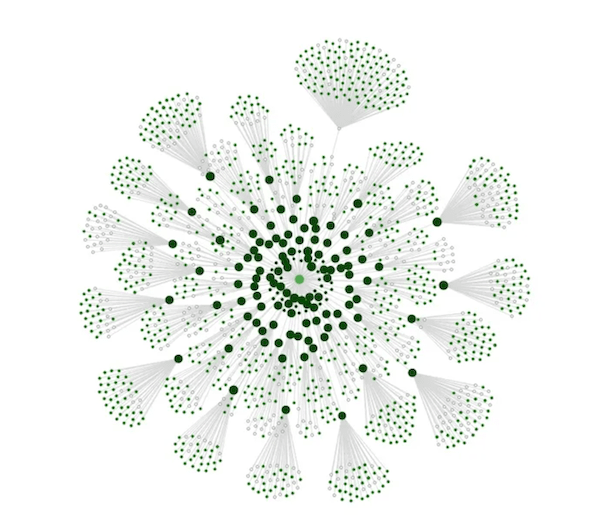
Visualization
The software also provides you with a spatial visualization of your site's structure by including your internal linking.
The graph puts the PageRank (size of the graph nodes), the depth of the pages, the noindex URLs, etc. in a visual format.
Performance
Finally, the “Performance” tab shows the response time of the different URLs crawled.
This report allows you to highlight the different pages of your site that don’t perform well in terms of loading speed in order to correct the situation and improve this technical aspect.
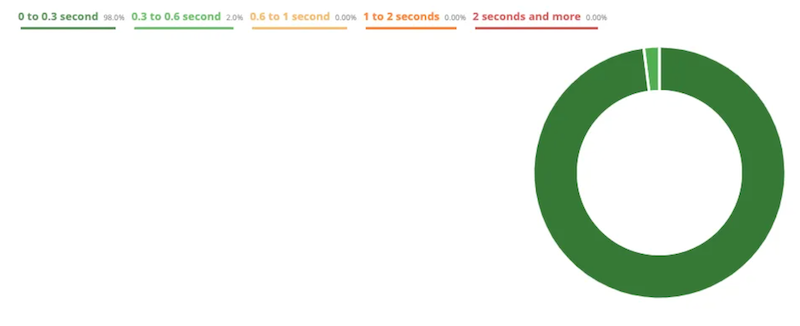
In this example, the graph shows that the majority of pages are fast to load (98% take between 0 and 0.3 seconds).
When you analyze your page, consider using the Google tool https://developers.google.com/speed/pagespeed/insights/ to detect what slows down your page and find opportunities for improvement. It’s common to find scripts or images that are too heavy.
Crawl Evolution
This part is similar to the “Crawler” part. Its main difference is, as its name indicates, that it allows you to compare several crawls with each other.
For example, if you’re working on the correction of elements such as HTTP 404 codes or depth, you can then launch a new crawl and compare it to the old one.
This analysis is very helpful for visualizing your corrections and optimizations effectively.
Here are some examples:
- “Depth” section
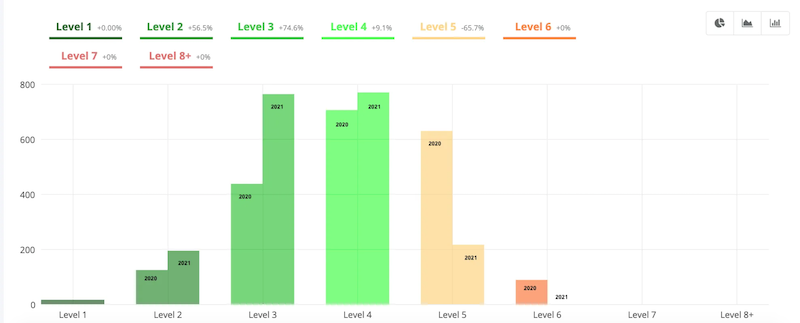
Here, we notice that a depth reduction work has been done on the site between 2020 and 2021.
The majority of the pages on the site have been moved closer to the home page. There are no more pages 6 clicks from the homepage, there are fewer at 5 clicks, and, logically, there are more at level 2, 3, and 4.
- “HTTP Codes” section
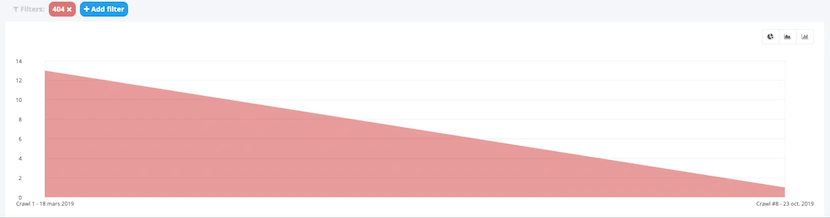
In this other example, the site went from 13,404 errors during the first crawl to 1 during the second one. In fact, 92% of the HTTP 404 codes have been corrected.
You can compare a lot of other elements like indexable URLs, number of words, loading time, etc.
- “Links” section
This tab allows you to compare your average number of inbound links per page type, over multiple crawls.
For example, if you reduce the number of inbound links that aren’t beneficial for SEO to a section of your site, the comparison with an old crawl will allow you to quickly identify the decrease in the number of inbound links.
You can then quickly compare the old number of links with the new one.
- “Cross analysis” section
Last but not least, the “Cross analysis” section is a special feature of the tool.
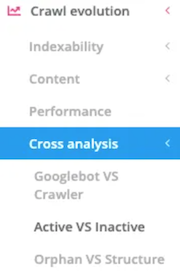
If you’ve activated the “Cross analysis” box when launching your crawls, you can compare the information retrieved from the Seolyzer crawl but also from Googlebot while comparing two different analyses.
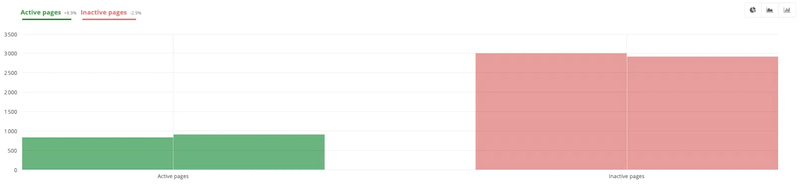
For example, here, the comparison of two different crawls shows that there are now more active pages on the site and fewer inactive ones. Optimization work was surely done after the first crawl.
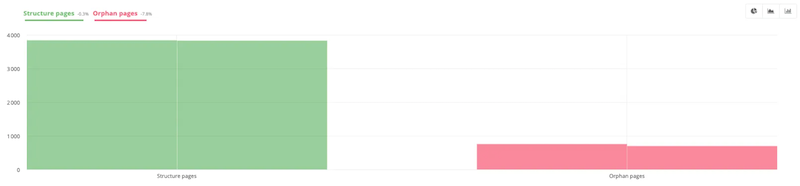
Another example, using the “Orphan Vs. Structure” section, shows that the percentage of orphan pages has decreased between the two analyses. Those present in the structure have remained about the same. This means that the person may have deleted some orphan pages after the first analysis.
Log analysis
Next, we come to the historical functionality of the tool: the log analysis.
This is where you can study the behavior of search engine robots on your store.
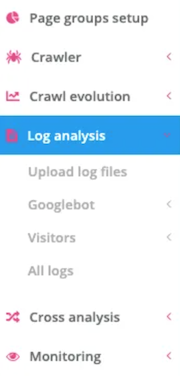
Googlebot
This tab is dedicated to the tracking of Googlebot on your site. Its behavior won’t be a secret to you any longer after discovering this section!
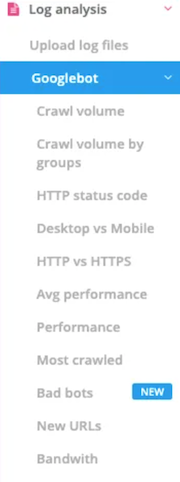
- Crawl volume
This tab lists the number of pages viewed by Googlebot with a choice of granularity: by month, week, day, hour...
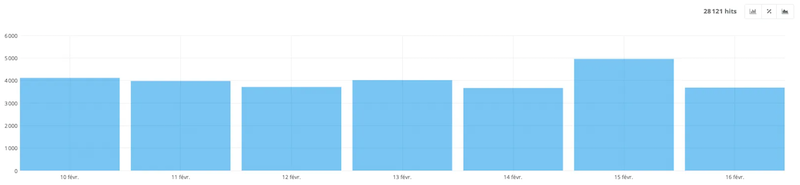
Here, you can see on this site that Google’s robots consult about 4,000 URLs per day. The more powerful and voluminous your site is, the more the bots will visit your site.
For example, here’s a site launched during the year 2020:
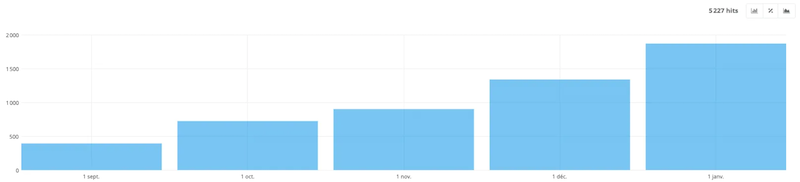
We can clearly see that the passage increases little by little with time.
- Crawl volume by group
As for the sections that represent the groups that you’ve configured, you can review the different categories.
This part is very interesting because it allows you to check if the robot has the same vision of your site as you do.
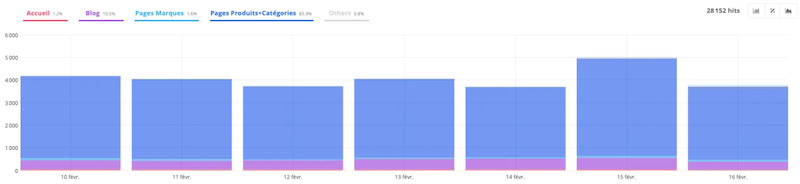
This example above shows us that the majority are focused on the categories and products of the site. This is, in principle, a good thing since these are sections of the site that directly generate sales.
On the other hand, if in your analysis, you notice that most of your crawled URLs concern uninteresting sections of your site, it may be wise to implement corrections to redistribute the crawl effectively.
For example, on a technically misconfigured ecommerce site, the majority of crawls may be on faceted filters or sorting.
- HTTP status code
As for the “Crawler” part’s report, this one indicates the HTTP codes encountered by the bot.
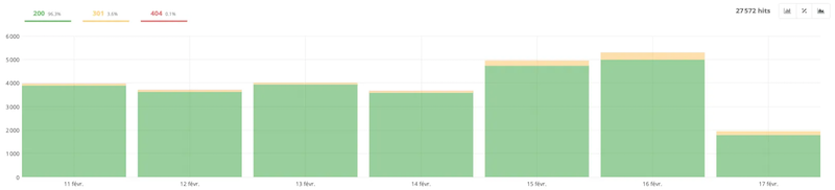
In this example, the majority of the site responds in 200, which is a good indicator. You should simply check the different 301 and 404 codes to correct, if necessary, the pages that lead to them.
It’s quite possible that you’ll find different data from the crawler in this report. Google scans all the pages that aren’t necessarily present in your site at a given time, because it has a history.
For example, if you’ve set up redirects, if you’ve deleted URLs, or if you have backlinks pointing to non-existent pages, etc., the robot may very well visit them regularly. There may be various reasons for the differences in that data that you need to study carefully.
- Desktop vs. Mobile
This part allows you to discover the distribution according to mobile and desktop.
Naturally, with the importance of mobile and the deployment of mobile-first design, the crawl tends to focus mainly on mobile.
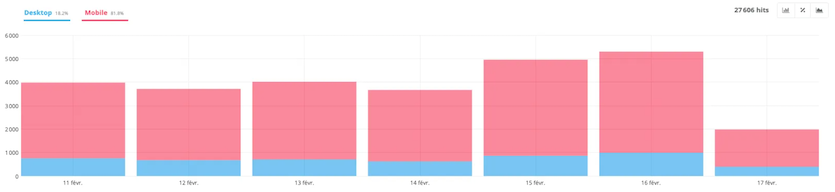
In this example, we have an ecommerce site that has the AMP version. It also has a mobile-first design, which greatly facilitates the passage of the mobile robot.
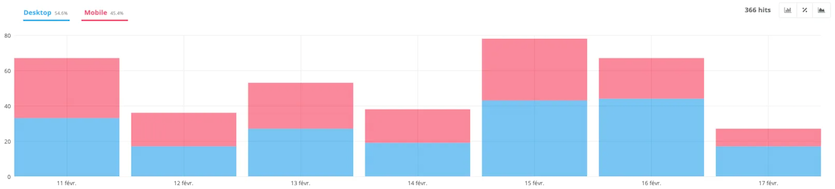
In this other example, the mobile-first design has not yet been deployed. The ratio between mobile and desktop is almost equal, with a slightly higher percentage of desktop.
- HTTP vs. HTTPS
The HTTP vs HTTPS report tells you whether the robot is crawling secure or non-secure pages on your site.
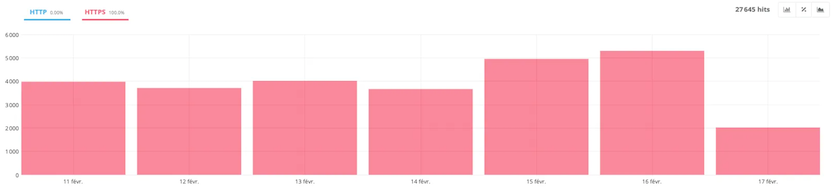
As a general rule, if your configuration is good and you’re running a site in HTTPS, there should be no problem.
When migrating from HTTP to HTTPS, this report can be very useful to check the transition to the new version.
- Avg performance
This section highlights the average response time per page when the bot passes. This response time represents the time the server takes to generate the page and send the first byte. It comes just before the time to first byte (TTFB), which includes the network transfer time.
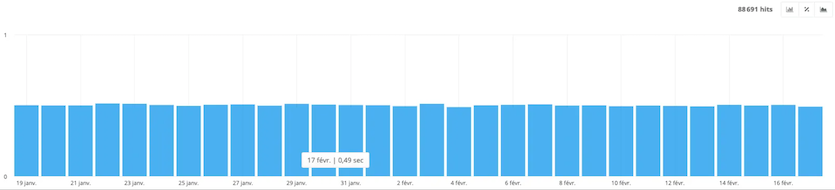
In this example, the average response time of the site’s URLs is 0.49 seconds on February 17th. For the other days, the response time is quite similar.
- Performance
This tab provides you with response time details, URL by URL.
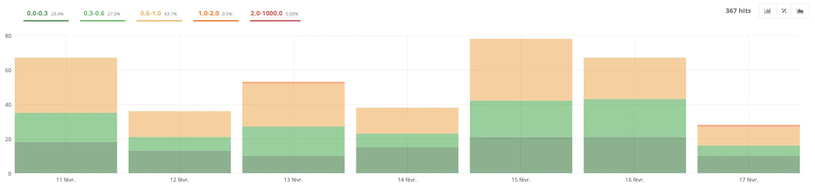
For example, by clicking on the part with a loading time “1.0-2.0,” you can discover the detail with the different URLs that take quite a long time to load.
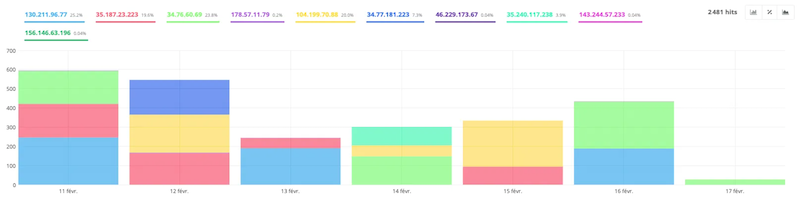
- Most crawled
“Most crawled” is another important tab of the tool. It classifies all explored visits by the number of Googlebot visits.
You can quickly analyze where the bot is focusing. As for the “Crawl volume by group” tab, you should study the report carefully to check if everything seems relevant.
For example, if your homepage and your products/categories are the most frequently crawled, that’s a good thing. On the other hand, if your top-crawled pages are the terms and conditions or other pages, it may be worthwhile to implement improvements.
This tab provides you with response time details, URL by URL.
- Bad bots
Bad bots are bots that pretend to be Google. Bad bots may have the objective to retrieve data, spam forms, or other malicious activities.
You’ll see that there are many more of them coming to your site than you might think!
- New URLs
This section allows you to identify the URLs crawled for the first time by the bot.
If you create new pages on your site, you’ll quickly identify them in this report.
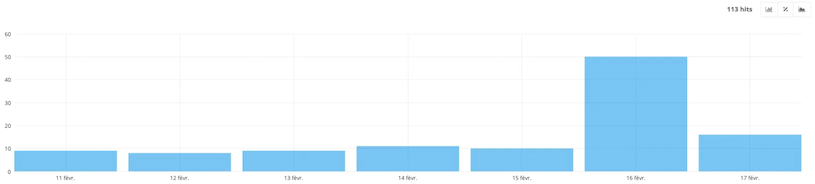
For example, here, the report shows that 113 new URLs have been discovered in the last 7 days. This is an ecommerce site, so the pace of adding products and content is quite high.
- Bandwidth
This tab displays the bandwidth used by Googlebot. It’s only dedicated to an installation on a dedicated Apache or Nginx server. If you’re on a shared server, you won’t have any data at this level.
Visitors
The “Visitors” part is dedicated to internet users’ “real” visits on your site. Several sections are available to provide you with an accurate and detailed view. These reports complement those available on Google Analytics.
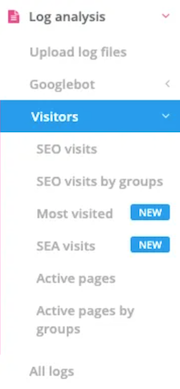
- SEO visits
This first report shows the number of visitors coming from search engines.
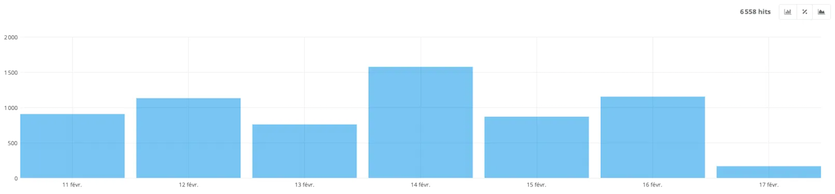
For instance, here, during the last 7 days, 6,558 visitors came to the ecommerce site via the SEO lever.
- SEO visits by groups
This tab allows you to highlight the groups on your site that generate the most visits and those that generate the least.
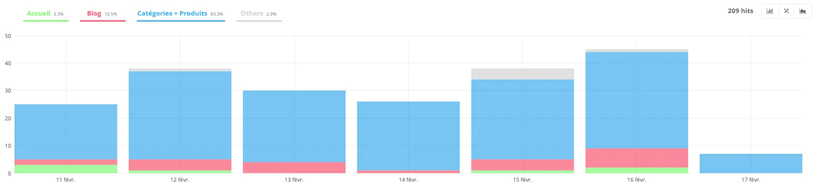
The example above shows us that 83.3% of SEO traffic comes from categories and products, 10.5% from the blog, and 3.3% from the homepage, which is a pretty good indicator.
In ecommerce, the business pages are the product pages and the categories. Having a majority of traffic on these parts of the site is beneficial for generating sales!
- Most visited
Just like the “Most Crawled” tab, you can discover the pages ranked by number of SEO visits here.
- SEA visits
The “SEA visits” tab displays your visitors coming from online advertising, generated with Google Ads.
Of course, if you don’t run ads on your site, this report will be empty.
- Active pages
Active pages are represented by those that generate at least one SEO visit.
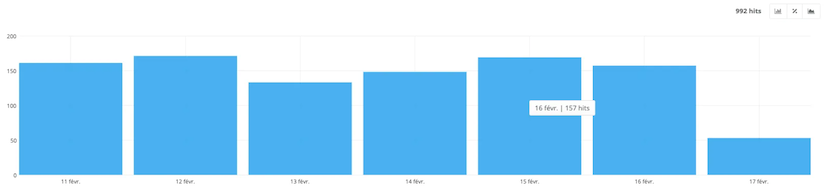
For example, the report, above, tells me that on February 16th, the site had 157 pages that generated at least one SEO visit.
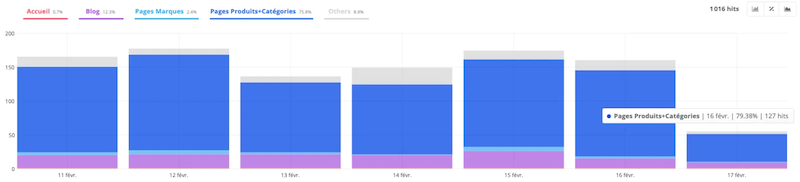
- Active pages by groups
I can therefore easily identify that on February 16th, of the 157 pages that generated at least one SEO visit, 79.38% of them were from categories and products.
All logs
Finally, this tab lists all visits from Googlebot, SEO, and SEA.
Cross analysis
One of the last interesting aspects of the tool is “Cross analysis.”
This tab allows you to couple the different data from the crawl and the logs in order to obtain a very detailed analysis of your site.
- Graphic Dashboard #1
The first section of the dashboard highlights the pages crawled by Googlebot, those crawled by Seolyzer, and finally, those that Googlebot and Seolyzer have both crawled.
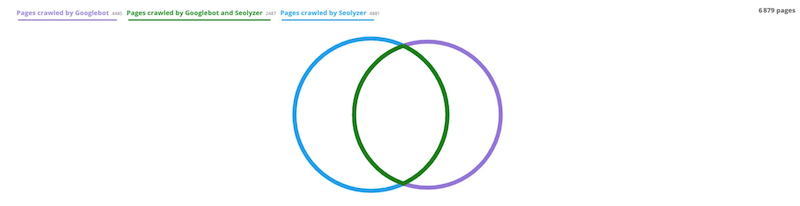
In the example above, we can quickly notice that some pages are crawled by Seolyzer but not by Googlebot; these are the unknown pages.
Conversely, some pages are crawled by Googlebot but not by Seolyzer; these are the orphan pages. The goal is obviously that the two circles overlap as much as possible
For the tool, an inactive page is a page that hasn’t generated any SEO visits in the last 30 days. I'll explain this idea just a little bit further down.
If Googlebot can see pages that your crawler can’t detect, it’s often related to an orphan page problem. This is also something that I’ll explain to you just a little later.
- Graphic Dashboard #2
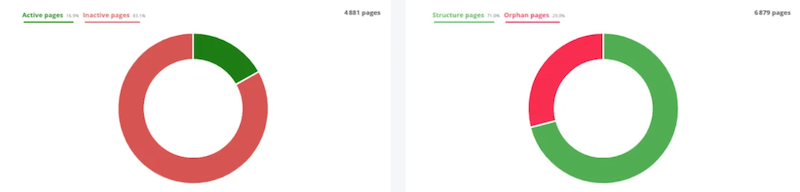
Still in the dashboard, the graph on the left offers a global vision of the percentage of active and inactive pages on the site.
By coupling the data, Seolyzer shows that on this site, during the last 30 days, 16.9% of the pages have generated at least one SEO visit, while 83.1% haven’t generated any traffic.
In SEO, inactive pages are a real drag for the site. It’s therefore likely that this site can considerably improve its SEO by working on them.
The graph on the right represents the percentage of pages that are linked within the site structure (71.0%) and those that are not (29%). These are what we call orphan pages.
Again, this is about 30% of the pages that have no internal link and do not benefit from the internal “link juice.” It can therefore be very beneficial to add links to get them back into the structure.
- Active pages
This tab gives the details of the different pages of the site that have generated at least one organic visit during the last 30 days.
- Inactive pages
This tab gives the details of the different active pages of the site that haven’t generated any SEO visits during the last 30 days.
Of course, each URL must be analyzed on a case-by-case basis. In general, this inactivity is linked to a lack of content or a level of depth that’s too high in the tree structure of the site.
- Active vs. inactive
This graph is quite interesting since it correlates the active and inactive pages of the site according to their depth level.
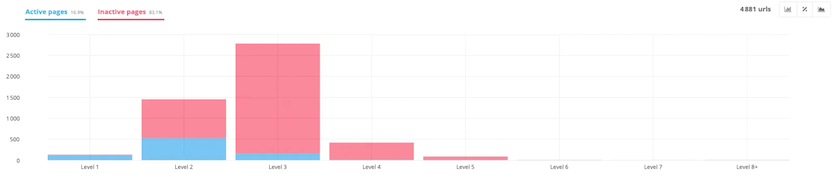
As most SEO specialists point out, the level of depth plays an important role in a page’s positioning. The deeper a page is in the site, the less power it has.
This example confirms it!
In the graph, we can see, very quickly, that the deeper we go in the tree structure of the site (level 3 and 4), the higher the percentage of inactive pages.
It can therefore be a good idea to work on the structure of the site to bring them as close as possible to the home page.
- Orphans
The orphan pages are those crawled by Googlebot but that do not appear during your crawl. They’re often those that Google knows about but that are no longer or not part of your tree structure.
They’re classified according to different categories to help you in your analysis:
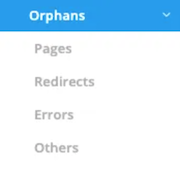
The “Pages” tab contains those that respond in 200 but are not related to the structure of your site.
It’s possible to find the robots.txt file, the sitemap file, URLs with parameters (affiliation, utm, etc), etc.
Of course, you can discover important pages for your business that no longer have any internal link from your site. These cases can often appear following a site redesign or the creation of a landing page, for example.
For these pages, it’s important to integrate them back into your site to give them power.
The “Redirects” tab displays the redirects followed by Googlebot that aren’t present in the structure of your site.
For instance, if you changed the URL of a page and added a 301 redirect, the robot will continue to visit the old page for a few weeks. It’ll no longer be linked to your site, but the search engine will continue to visit it.
The “Errors” tab represents those in 404 error, not present in your structure.
For example, if a page on your site that no longer exists has backlinks, it’ll be visited by Googlebot but will respond in error. It would therefore be advantageous to redirect it!
Finally, “Others” lists the other types of orphaned URLs that Googlebot has encountered. These may include, for instance, those removed from your site with a 410 code.
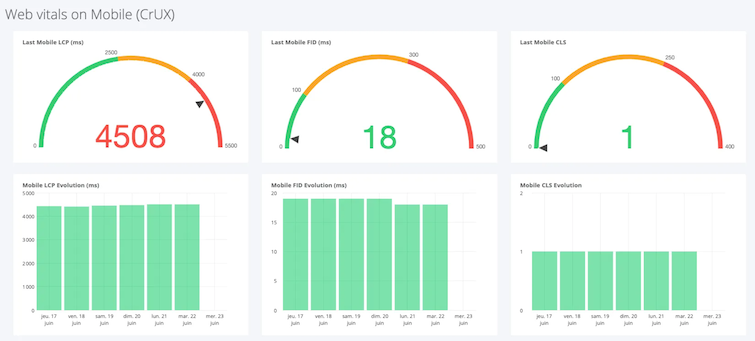
Core Web Vitals
Core Web Vitals are represented by three indicators (LCP, FID, & CLS) that are added to the user-experience signals (mobile friendly, secure browsing, intrusive HTTPs, and interstitials). This data is now integrated into Google’s ranking algorithm.
In the “Core Web Vitals” tab, Seolyzer displays a dashboard with these elements, retrieved directly from the CRUX database.
Via Chrome, Chromium, and Android browsers, this database continuously collects information related to the user experience. The information is very relevant, as it reflects the real experience of the users.
I plan to write a full article on Core Web Vitals to explain these new indicators in more detail and what they correspond to in your website.
Monitoring
The last section of Seolyzer, “Monitoring,” allows you to monitor your robots.txt, one of the most sensitive files in SEO.
As soon as a modification of this file is detected, you’ll receive an alert by email.
If it’s also not detected and returns, for example, a 500 error, the software also sends you an alert and keeps the history of all versions.
In conclusion, Seolyzer allows you to work with advanced data while enjoying a visual and accessible interface.
With this guide, you now have everything you need to use it effectively and optimize your
Take advantage of a 10% discount on your monthly subscription to the tool with the code "wizi"!


![Keyword research tool: 11 of the best free and paid tools in 2026 [+ Bonus!]](https://wizishop.com/media/61db2a7e5bab8a085f2c7e8b/v1/keyword-research-tool-wizishop.jpg.webp)


